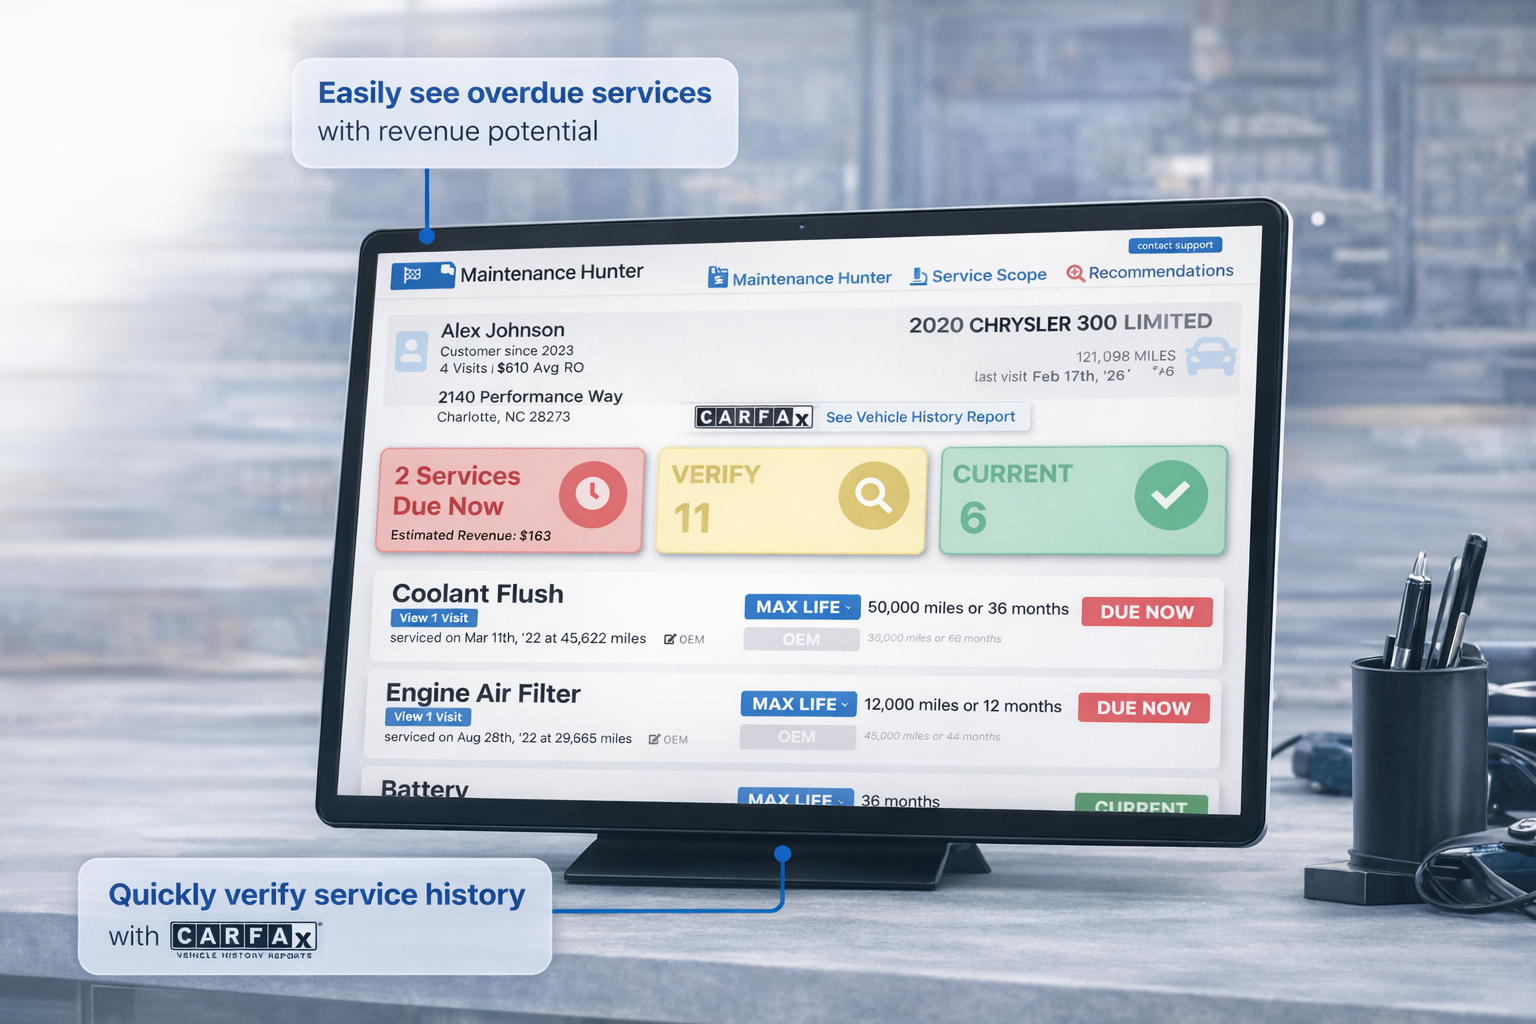
I talk a lot about the revenue that’s already in your bays. Not new customers. Not a bigger ad budget. The maintenance work that’s due on the cars already sitting in your shop — that nobody’s looking at.
Steger Service in St. Louis is a perfect example of what happens when a shop decides to actually look. They’ve been a SideKick360 customer since 2022. Good shop, solid operation, steady car count. But at the start of 2026, they made a deliberate decision to start running Maintenance Hunter on every vehicle — at the counter, before writing up the ticket, not after. One process change. One tool.
Six Months In: +$273K in Gross Profit
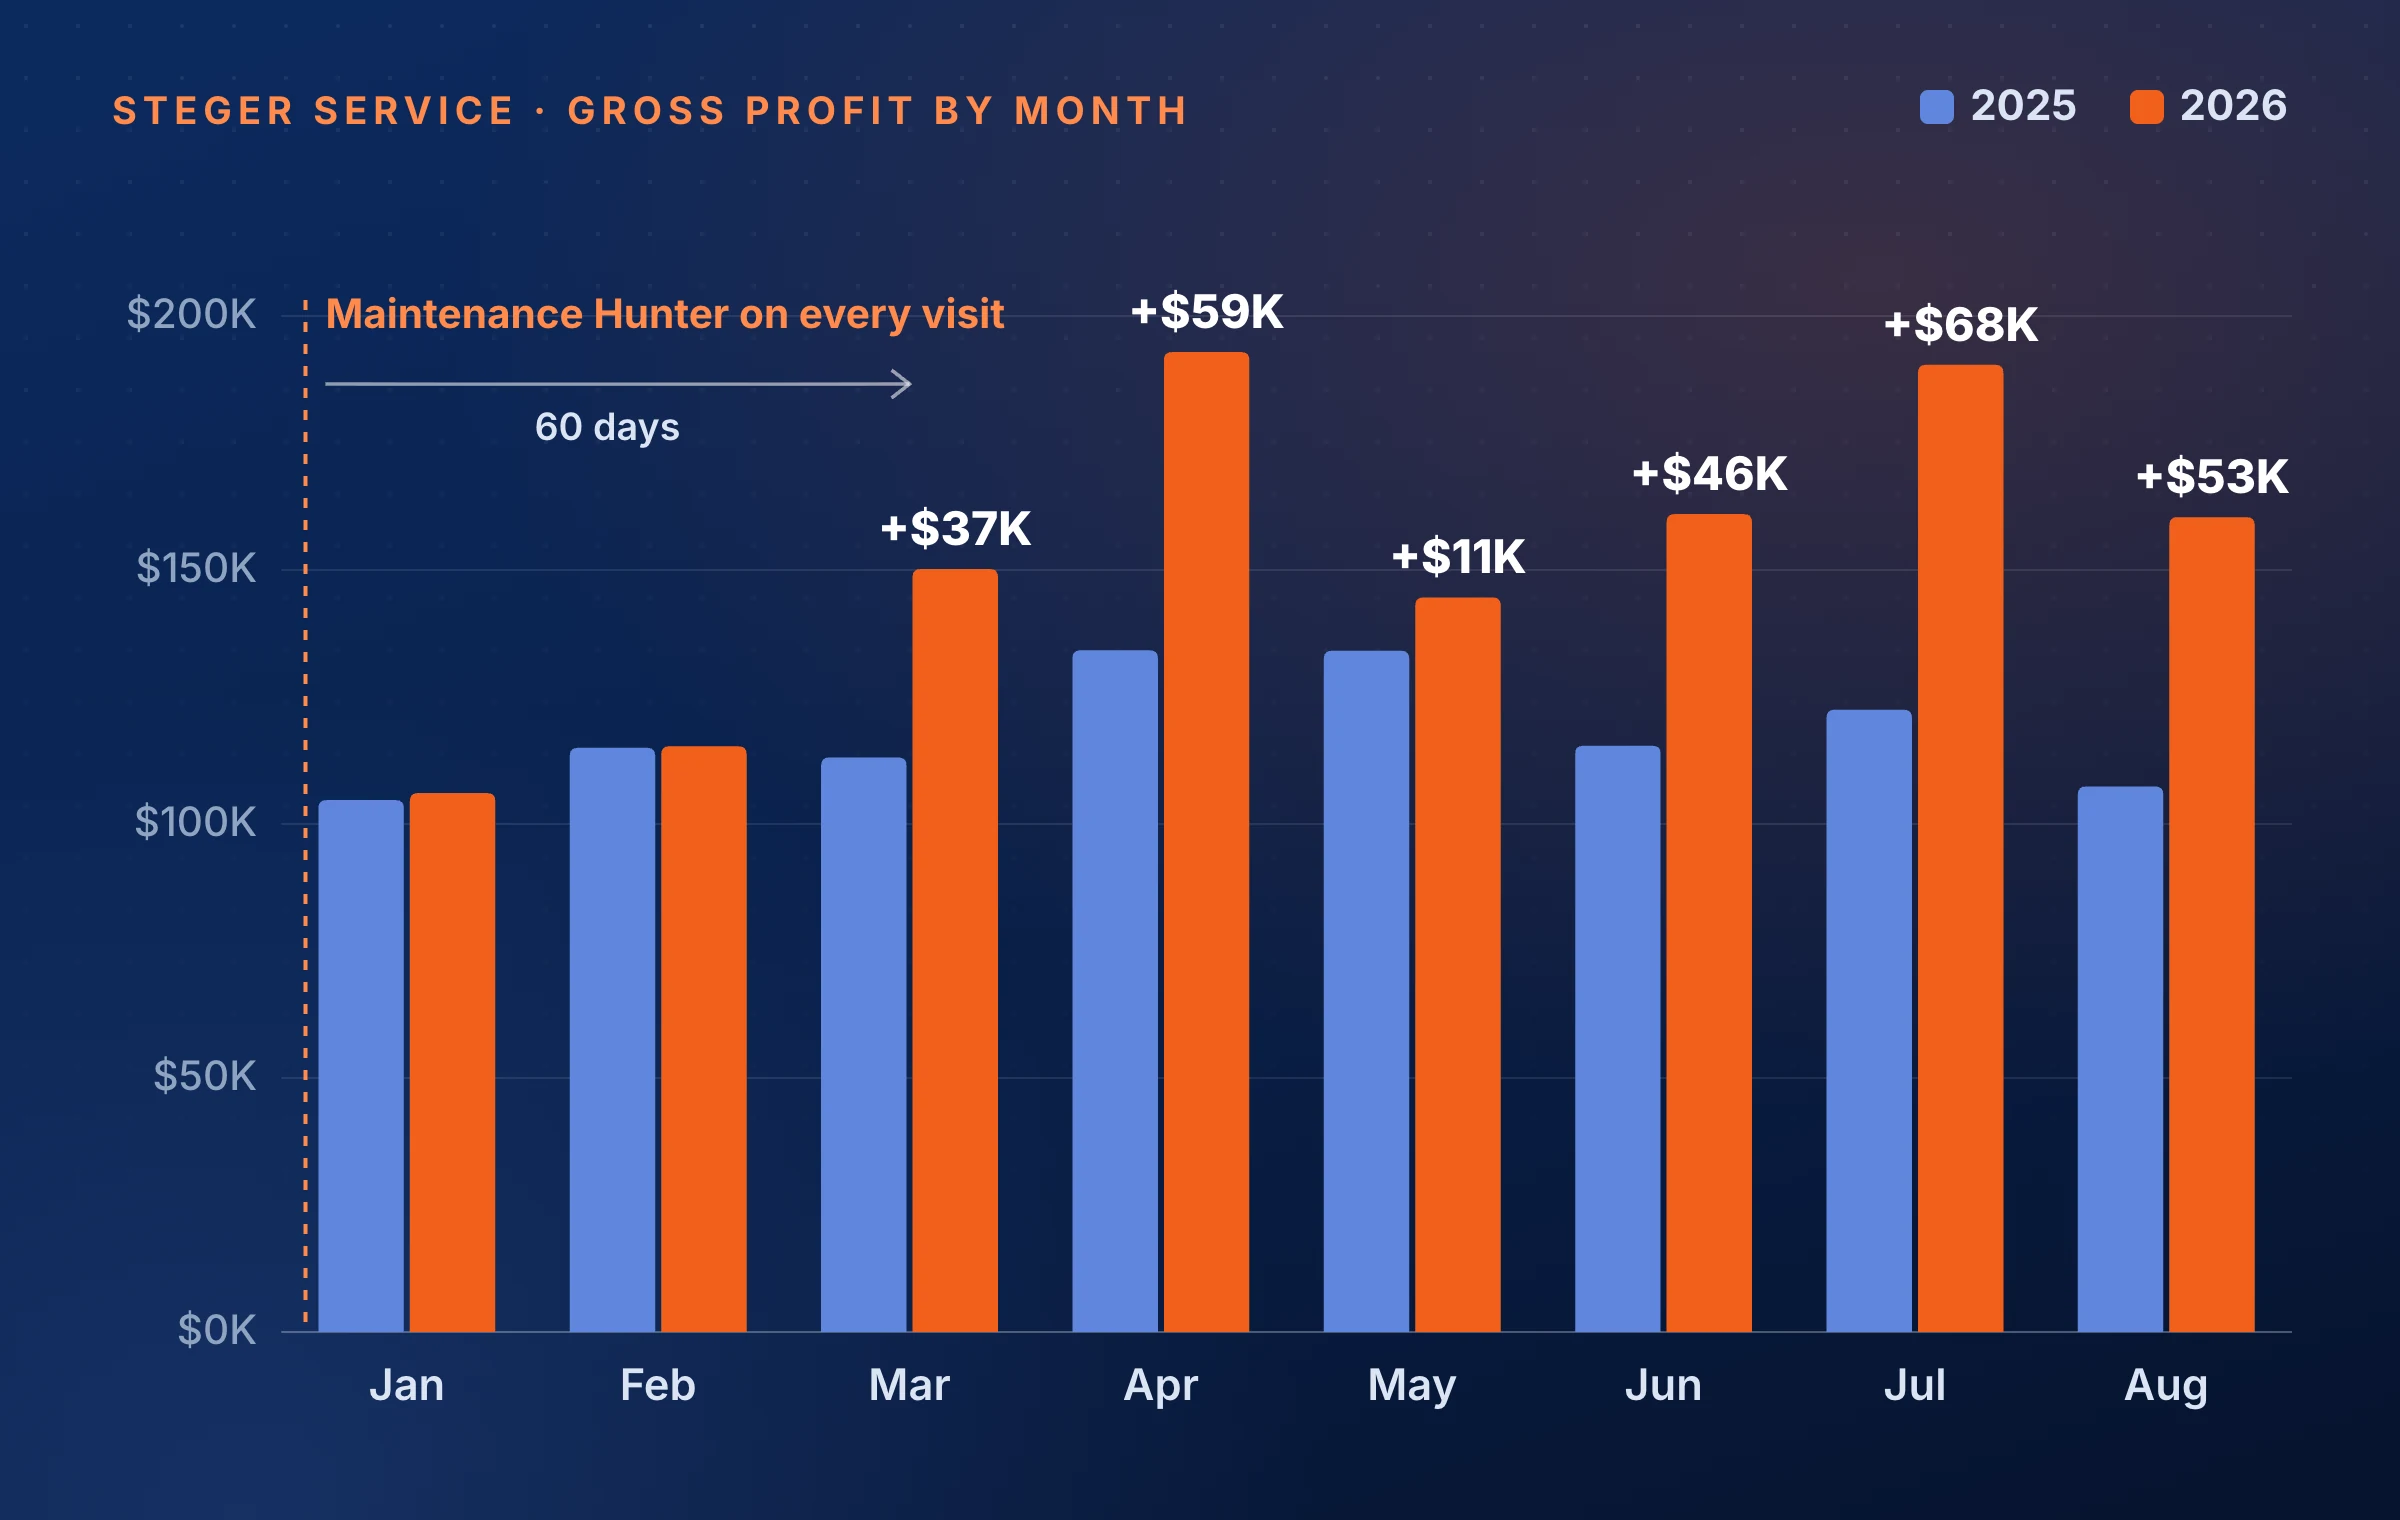
In April we wrote about Steger’s first quarter. The question was whether it would stick. It did. From March through August 2026, Steger Service added $272,805 in gross profit over the same six months of 2025, about $45,000 a month. Every one of those months beat the year before.
| March–August | 2025 | 2026 | Change |
|---|---|---|---|
| Gross Profit $ | $726,747 | $999,552 | +$272,805 (+37.5%) |
| Gross Profit / month | $121,124 | $166,592 | +$45,468 |
| Total Sales | $1,371,884 | $1,766,970 | +28.8% |
| Gross Profit % | 53.0% | 56.6% | +3.6 pts |
| Invoices (car count) | 2,322 | 2,763 | +19.0% |
| Average RO | $591 | $640 | +$49 |
| Effective Labor Rate | $139.38 | $146.81 | +$7.43/hr |
| Labor Hours | 5,064 | 6,355 | +25.5% |
| Maintenance Gross Profit | $210,854 | $336,806 | +$125,952 (+60%) |
Lead With Maintenance. Everything Else Follows.
Maintenance did exactly what you’d expect: maintenance gross profit up 60%, with the maintenance margin rising from 55.1% to 60.7%. Coolant system services went from 104 to 219 jobs. Brake flushes from 187 to 244. Spark plugs from 53 to 76. Hoses from 49 to 72. Alignments from 110 to 150.
But maintenance is only about half of the $272,805. The rest came from the whole shop moving at once: 19% more cars, a $49 bigger average ticket, a labor rate up $7.43 an hour, 25% more billed labor hours, and margin on everything up from 53.0% to 56.6%. When every visit starts with what the car actually needs, the customer trusts the shop more, the tickets get bigger, and the techs stay busy. That’s the part that doesn’t show up if you think of maintenance as a line item.
Figures come from Steger Service’s own repair orders in SideKick360 Performance Hub, March–August 2026 vs. the same months of 2025. The 2025 data ends August 29, so last year is missing two days. The first-quarter figures below are as published in April.
Where It Started: Q1 2025 vs. Q1 2026
Same shop. Same team. Same location on Manchester Road. The only real change was how consistently the service advisors used Maintenance Hunter at the point of write-up. Here’s what moved:
| Metric | Q1 2025 | Q1 2026 | Change |
|---|---|---|---|
| Total Sales | $633,223 | $665,181 | +5.0% |
| Invoices | 1,186 | 1,227 | +3.5% |
| Gross Profit $ | $332,798 | $371,420 | +$38,622 |
| Gross Profit % | 52.6% | 55.8% | +3.2 pts |
| Labor Hours | 2,241 | 2,475 | +10.4% |
| Parts GP % | 46.3% | 51.4% | +5.1 pts |
| Unique Customers | 869 | 915 | +5.3% |
Read that carefully. Sales went up 5.0%. But gross profit went up $38,622 — an 11.6% jump that far outpaced the revenue increase. The margin expanded by 3.2 full percentage points. All of it came from one place: improved maintenance execution.
Here’s what makes it even more striking: $36,946 of that $38,622 came from March alone. In a single month, Steger posted $150,080 in gross profit at a 57.1% margin — up 32.7% and 4.7 margin points over March 2025. January and February were essentially flat year over year. The improvement isn’t averaging out over the quarter. It’s accelerating. The longer the team runs Maintenance Hunter consistently, the bigger the gap gets.
Where the Growth Actually Came From
When you break it down by service category, the story gets even clearer. The biggest year-over-year jumps were in exactly the services Maintenance Hunter flags as “Due Now” — the work that’s overdue based on mileage and time intervals, but that nobody mentions unless they’re looking at the data.
| Service | Q1 2025 | Q1 2026 | Change |
|---|---|---|---|
| Cabin Air Filter | 22 | 83 | +277% |
| Fuel System Service | 7 | 19 | +171% |
| Engine Air Filter | 46 | 106 | +130% |
| Coolant Flush | 60 | 97 | +62% |
| Brake Flush | 89 | 124 | +39% |
| Oil Change | 338 | 445 | +32% |
| Brake Service | 69 | 79 | +14% |
Cabin air filters went from 22 to 83 — a 277% increase. Fuel system services up 171%. Engine air filters more than doubled. Coolant flushes up 62%. These aren’t services customers are requesting. These are services the advisor is recommending because Maintenance Hunter shows them what’s due before the conversation even starts. Every one of these is a high-margin, low-complexity job that takes minimal bay time. And every one of them was being missed before.
March 2026: The Breakout Month
If you want to see what happens when the process really locks in, look at March in isolation. This is what a single month looks like when the team is running Maintenance Hunter on every vehicle consistently:
| Metric | Mar 2025 | Mar 2026 | Change |
|---|---|---|---|
| Monthly Sales | $216,105 | $262,856 | +21.6% |
| Gross Profit $ | $113,134 | $150,080 | +32.7% |
| Gross Profit % | 52.4% | 57.1% | +4.7 pts |
| Average RO | $518 | $585 | +12.9% |
| Labor Hours | 785 | 955 | +21.7% |
| Parts GP % | 46.7% | 52.9% | +6.2 pts |
In March alone, the maintenance-first process added $36,946 in gross profit over the prior year. Cabin air filters went from 7 to 39 — a 457% increase in a single month. Engine air filters jumped from 16 to 52. Coolant flushes doubled from 17 to 34. The team isn't slowing down. They're getting better at it.
Why Filters and Flushes Matter More Than You Think
There’s a reason the biggest jumps are in filters and fluid services. These are high-margin, low-complexity jobs that take minimal bay time. A cabin air filter is a five-minute install with strong parts margin. A coolant flush is a straightforward service that most shops can knock out quickly. These aren’t big-ticket repairs — they’re the maintenance work that adds $40, $80, $120 to a ticket without adding meaningful time to the repair order.
And that’s exactly why they get missed. When an advisor is focused on writing up what the customer came in for, nobody’s thinking about whether the cabin air filter is two years overdue. The customer isn’t going to ask for it. The advisor isn’t going to guess. Without data at the counter, that revenue walks out the door every single time.
Related: How Meineke Doubled Revenue • Why Every Vehicle Deserves an Inspection • See Maintenance Hunter in Action
Parts Margin Tells the Real Story
One number that jumps off the page is parts gross profit percentage: 46.3% in Q1 2025, 51.4% in Q1 2026. That’s a 5.1-point improvement. The shop isn’t selling more parts — they’re selling higher-margin parts. Maintenance items like filters and fluids carry better margins than commodity repair parts. When advisors run MH on every vehicle, the parts mix shifts automatically. And here’s what’s remarkable: parts cost actually went down $10,907 year over year while parts sales went up. They’re spending less on parts and making more — that’s the power of a better mix.
What does that mean? Steger shifted toward selling more maintenance parts — filters, fluid services, preventive items — and fewer low-margin commodity parts. They’re selling smarter, not just selling more. The mix changed because the conversation at the counter changed.
Labor Hours Up 10.2% — Without Adding Staff
Labor hours went from 2,241 to 2,475 — an extra 234 hours of billed labor in the same period. That’s the equivalent of nearly six full-time weeks of tech labor across the quarter. Not by hiring. Not by extending hours. Just by running Maintenance Hunter on every vehicle and identifying work that needed to be done.
When advisors have the data in front of them, the write-up changes. Instead of “oil change,” the ticket becomes “oil change, cabin air filter due at 30K, coolant flush overdue by six months.” The tech has more work on each car. Bay utilization goes up. Everyone wins.
What Changed — And What Didn’t
I want to be clear about what Steger Service did and didn’t change. They didn’t remodel. They didn’t run a marketing blitz. They didn’t hire a new service advisor. Car count went up 3.5% — a modest, organic increase that you’d expect in any healthy shop. The difference was the process at the counter.
What changed was the process at the counter. The advisor pulls up the vehicle in Maintenance Hunter before writing the estimate. They see what’s due, what’s overdue, and what’s coming up. That information becomes part of the conversation with the customer — not a hard sell, just a “hey, your cabin air filter is two years past due, want us to take care of that while we’ve got the car?”
That’s it. Run Maintenance Hunter on every vehicle. Let the data drive the conversation. Over the full quarter, it produced $38,622 in additional gross profit — and the momentum is building. March was the breakout month: $262,856 in sales, $150,080 in GP, and a 57.1% margin. The team is getting better at this every month.
The Compound Effect
Here’s what makes this even more interesting. When you start surfacing maintenance at the counter, you’re not just adding revenue today. You’re changing the customer’s expectation. They start to see your shop as the place that keeps their car healthy, not just the place that fixes what’s broken. That builds retention, increases visit frequency, and turns a transactional relationship into a maintenance relationship.
Steger’s new customer count went from 284 to 321 — a 13.0% increase. And their unique customer count went from 869 to 915. More customers coming back, plus more new customers walking in. That’s the flywheel starting to turn.
The Bottom Line
Steger Service didn’t transform their business overnight. They did something simpler and harder: they committed to running Maintenance Hunter on every vehicle. Not some vehicles. Not when they remembered. Every vehicle, at the counter, before the write-up. Within 60 days it showed up in the numbers. Six months in, it’s $272,805 in additional gross profit, about $45,000 a month, with sales, car count, labor rate and margin all up with it.
The revenue was already there. It was sitting in their bays every day. They just started looking at it.
See It in Your Own Shop, Every Night
The process only sticks if you can see it working. SideKick360’s Report Hub sends one link to the owners and managers you choose, every night by text or email, or on demand from the app: Operations, year-over-year, Missed Opportunity, Tire Analysis and an AI quick win for tomorrow’s huddle. You see what you sold, what walked out the door, and whether leading with maintenance is taking hold.

If you want to see what Maintenance Hunter can surface in your shop’s data, book a demo at sidekick360.app/schedule-demo. We’ll pull your actual numbers and show you exactly where the opportunity is.