Ask ten auto repair shop owners what KPIs they track, and you'll get ten different answers — plus a few blank stares. Most shops are running on lagging indicators: last month's sales, last quarter's P&L, an end-of-year summary. That's not a KPI strategy. That's looking at the scoreboard after the game.
Real KPI management means knowing, every day, whether your shop is winning or losing — and why. Here are the 10 metrics every auto repair and tire shop owner should track, the benchmarks that separate good from great, and how to actually measure them without drowning in spreadsheets.
Revenue & Profitability KPIs
1. Average Repair Order (ARO)
What it is: Total revenue divided by total repair orders for a period.
Benchmark: General repair $400–$550; top performers $700+. Tire-focused $300–$450. Specialty import $600–$900.
Why it matters: ARO is the single most leveraged KPI in auto repair. Moving it $50 per ticket across 1,000 tickets/month = $50K monthly revenue. See our full ARO playbook.
2. Gross Profit Percentage (GP%)
What it is: (Revenue − Cost of Goods Sold) / Revenue. Track labor GP and parts GP separately — they behave differently.
Benchmark: Total shop GP 50–60%. Labor GP should be 70–80%. Parts GP 35–45%. Tires often 20–25% — lower margin but high volume.
Why it matters: Revenue growth without GP growth is a trap. Some shops grow sales 20% and grow profit 0% because they're discounting to chase volume.
3. Effective Labor Rate (ELR)
What it is: Total labor revenue divided by billed hours. The real hourly rate your shop is actually getting, after discounts, comebacks, and warranty.
Benchmark: Within 90–95% of your posted door rate. If you're posted at $150/hr but your ELR is $115/hr, you're leaking $35 an hour to discounts and inefficiency.
Why it matters: Reveals whether your discount policy and shop efficiency are eating your margins.
Operational KPIs
4. Car Count
What it is: Number of unique vehicles serviced per period.
Benchmark: Varies enormously by market and shop type. What matters is your own trend — is car count growing, flat, or declining?
Why it matters: Car count is the denominator of everything. Declining car count is a leading indicator of retention problems.
5. Bay Productivity / Hours Sold per Tech per Day
What it is: Total billed labor hours divided by technician headcount and days open.
Benchmark: Top shops hit 7–9 billed hours per tech per 8-hour day (productivity >100%). Average shops run 5–6 hours.
Why it matters: If your techs are getting 5 hours of work done in an 8-hour day, you have 3 hours of capacity you're already paying for but not billing.
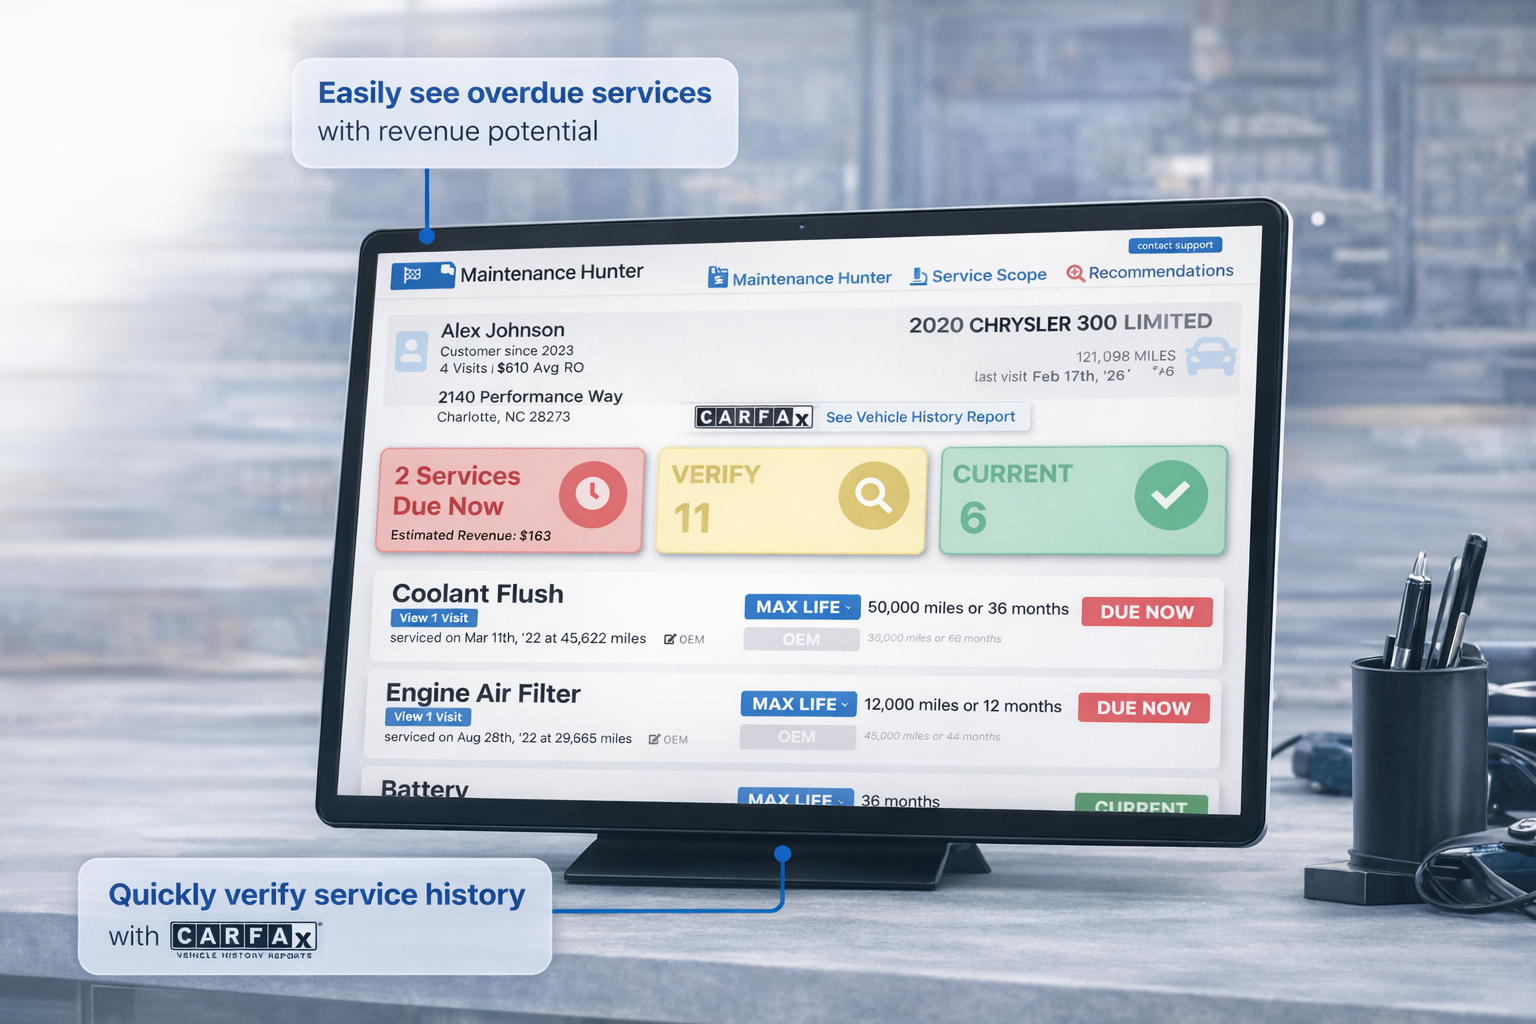
6. Maintenance Capture Rate
What it is: Of all services that were due per OEM maintenance schedules on the vehicles you serviced, what % did you actually recommend and sell?
Benchmark: Most shops operate at 30–50%. Top performers hit 70%+.
Why it matters: This is the most diagnostic metric in auto repair. Low capture rate = missed revenue that was already at your shop. See our guide on finding missed revenue.
Customer KPIs
7. Customer Retention Rate
What it is: % of customers from one period who return within the next 12 months.
Benchmark: 50–60% is average. 70%+ is strong. 80%+ is exceptional.
Why it matters: Acquiring a new customer costs 5–10x what keeping an existing one does. Retention is the most efficient growth lever you have.
8. New vs. Returning Customer Mix
What it is: % of monthly ROs from first-time customers vs. returning.
Benchmark: 15–25% new is healthy growth. Under 10% new = you're not replacing natural attrition. Over 40% new = you're probably burning through customers (bad retention).
Advisor-Level KPIs (Multi-Unit Essential)
9. Revenue per Advisor per Day
What it is: Total revenue for a period divided by advisor working days.
Benchmark: $4K–$7K per advisor per day is typical. $10K+ is top tier.
Why it matters: Normalizes for time worked and lets you compare advisors across stores fairly. Combined with ARO and car count, tells you the full story of each advisor's performance.
10. Inspection-to-Sale Conversion by Advisor
What it is: Of services recommended during inspection, what % did the customer approve?
Benchmark: 40–60% is typical. 70%+ is strong. Below 30% signals either over-recommendation or poor customer communication.
Why it matters: Distinguishes "recommends a lot but can't close" from "closes well but doesn't recommend enough." Each needs different coaching. See our advisor coaching guide.
Where Most Shops Get Stuck
Reading this list, most owners think: "I know what I should be tracking — I just don't have the tools to actually track it." That's the real problem. Your shop management system (NAPA TRACS, Tekmetric, Mitchell 1, FreedomSoft, TireMaster, R.O. Writer, TireWorks HD, Hoops & Gears, etc.) captures the raw data, but getting these metrics out typically requires either expensive custom reporting or hours of spreadsheet work every week.
Worse: if you're running multiple locations, every store's SMS data lives in its own silo. Getting consistent, normalized KPIs across all your stores is almost impossible manually — especially if stores run different SMS platforms.
SideKick360 exists specifically to solve this. It connects to your existing SMS, normalizes the data, and delivers all 10 of these KPIs — plus advisor-level scorecards, daily text reports, and multi-store benchmarking — without spreadsheets. Works across NAPA TRACS, Tekmetric, Mitchell 1, FreedomSoft, TireMaster, R.O. Writer, TCS TireWorks HD, Hoops & Gears, and Protractor — all on the same dashboard.
How to Implement a KPI Program (Without Overwhelming Your Team)
Don't try to roll out all 10 KPIs at once. Start with 3 shop-level KPIs (ARO, Car Count, GP%) and 2 advisor-level KPIs (Revenue per Advisor, Maintenance Capture Rate). Review them weekly with managers. Once that's a habit, layer in retention, bay productivity, and the rest.
The biggest mistake shops make is posting dashboards no one reads. A KPI program only works if someone is responsible for acting on the numbers. Assign an owner for each KPI — usually the shop manager — and make the weekly review a non-negotiable meeting. That's how numbers turn into behavior change.
Frequently Asked Questions
What are the most important KPIs for an auto repair shop?
The top 5 for most shops: (1) Average Repair Order, (2) Gross Profit %, (3) Car Count, (4) Customer Retention Rate, and (5) Maintenance Capture Rate. If you're multi-unit, add advisor-level ARO and inspection-to-sale conversion — these are where coaching conversations happen.
What's a good gross profit percentage for an auto repair shop?
Total shop gross profit should run 50–60%. Break it down: labor GP should be 70–80%, parts GP 35–45%, and tire GP 20–25%. If your blended GP is below 50%, check for excessive labor discounting, parts mark-up erosion, or shop productivity issues.
How do I track KPIs across multiple locations?
If all your stores run the same SMS, use that system's multi-shop reporting (where available). If stores run different SMS platforms, you need an analytics layer that normalizes the data — SideKick360 connects to 9 major SMS systems and produces consistent KPIs across mixed environments.
How often should I review shop KPIs?
Daily at the advisor level (ARO, car count, capture rate). Weekly at the shop level (full KPI scorecard). Monthly at the enterprise level (multi-store comparisons, retention trends). The higher the frequency, the faster you can course-correct.
Start Tracking What Actually Matters
Book a free 30-minute demo and we'll show you all 10 KPIs — calculated from your own shop's data — live in under 30 minutes. No setup required for the demo, just a quick connection to your existing SMS.
Related: How to Increase ARO • How to Find Missed Revenue • How to Coach Service Advisors • Multi-Unit Enterprise Analytics