If you've ever looked at your monthly P&L and wondered "we're busy — why aren't we making more?", this post is for you. The answer in most shops isn't pricing, it isn't marketing, and it isn't your advisors being lazy. The answer is hiding in plain sight in your shop management system's data. You just can't see it.
After pulling data from thousands of auto repair and tire shops running SideKick360, we can tell you with high confidence: most shops leave 20–40% of achievable revenue on the table every month. Not because they're doing anything wrong. The ticket-level view inside any shop management system is doing its job perfectly — recording exactly what happened. What SideKick360 adds is the view of what should have happened alongside it, so you can compare.
Here are the five places missed revenue hides — and how to find and recover it.
1. Overdue OEM Maintenance on Vehicles You Serviced
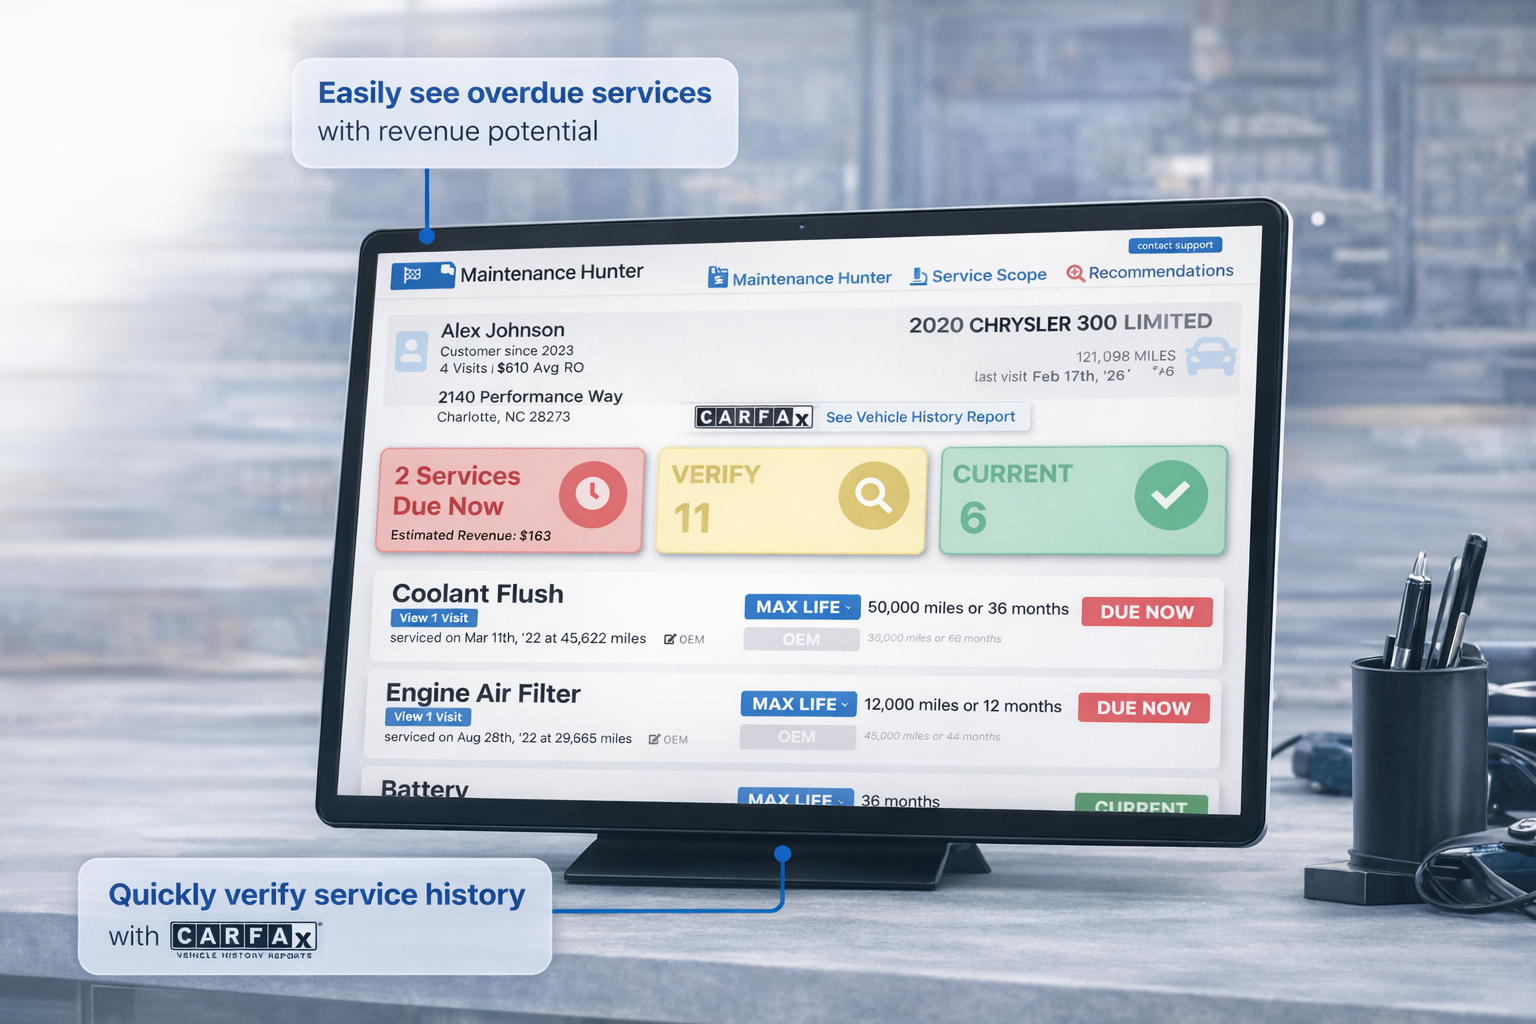
This is the biggest bucket, and it's almost invisible in standard reports. A customer comes in for an oil change. Their vehicle is at 85,000 miles. Based on the manufacturer's maintenance schedule, they're also due for: transmission fluid (60k interval), coolant flush (60k/5yr), brake fluid (30k/2yr), spark plugs (100k, approaching), cabin filter (annual), and possibly a differential fluid or transfer case service. Total opportunity: $400–$700 in additional work on a vehicle already at your shop.
What gets sold? The oil change. Maybe a tire rotation if the advisor remembers. The rest walks out. Multiply by 20 vehicles a day across your shop, then across every shop in your group, and you're looking at five or six figures of monthly revenue opportunity hiding in OEM maintenance intervals.
How to find it: You need a system that scans every vehicle against manufacturer maintenance schedules before the estimate is written. Maintenance Hunter inside SideKick360 does this in under 4 seconds per vehicle — pulling from OEM schedules, CARFAX, and prior invoices. Meineke Garner Group used this to grow ARO from $264 to $568 — same customers, same advisors, same shop. The revenue was already there.
2. Previously Declined Services That Never Got Followed Up
Every shop management system captures declined services. Almost none surface them on the next visit. A customer who declined a brake flush in January is probably ready to hear about it in April. But if the advisor doesn't know it was previously recommended, it goes unmentioned. That's revenue that was already almost earned, now missed.
How to find it: Run a report of declined services over the past 6–12 months, filtered by customer. Make sure advisors see this list at the next write-up. Best case: your analytics platform surfaces it automatically. Second best: a weekly email to advisors with their top-declined-services follow-up list.
3. Tire Upsells on Vehicles Already In for Service
If your shop sells tires, this is a goldmine you might be missing. When a car is in for brakes, an alignment, a suspension job — the technician sees the tires. If the tires are below 4/32" tread, that's a tire sale opportunity. If the tires are cupping due to alignment issues, that's a tire AND alignment opportunity. The vehicle is already on the lift.
Most shops miss this because tire condition isn't part of the standard inspection flow. Data from multi-unit tire operators running SideKick360 consistently shows that proactive tire assessments on non-tire service tickets add $80–$150 to ARO. Over a year, across a 10-store group, that's seven-figure revenue.
How to find it: Build tire-condition check into every vehicle inspection, not just tire service tickets. Track tire recommendations by advisor and by technician. Report tire sales per non-tire RO as a KPI.
4. Advisor Performance Gaps Between Stores
Here's a pattern we see constantly in multi-unit shops: Store A runs $550 ARO. Store B runs $380 ARO. Same customer demographic. Same service mix. Same SMS. Different advisors. Different processes. The difference is pure missed revenue — at scale.
If your weakest store could operate at the ARO level of your strongest store, how much additional revenue would that produce? Across 10 locations, an $80 ARO improvement on 1,000 tickets/month per store = $800,000 in monthly revenue opportunity. That's real.
How to find it: Compare every location on the same KPIs — ARO, maintenance capture rate, inspection conversion, services per RO. Normalize the data so the comparison is apples-to-apples even if stores structure their services differently. Multi-location analytics platforms exist specifically for this.
5. Customers You've Already Lost (Without Knowing It)
Your best revenue opportunity isn't always new customers — it's the lapsed customers you don't realize you've lost yet. A shop averaging 100 ROs per week has, in most cases, several thousand customer records. Some percentage of those haven't been back in 18+ months. Some are gone for good. Some are still reachable. If you can identify the difference, you can win back 10–20% of lapsed customers with the right outreach — and those customers have an existing vehicle service history, so their next visit is likely high-ARO.
How to find it: Segment your customer base by last-visit date. Anyone 6–12 months lapsed is a win-back opportunity. Anyone over 18 months is likely gone, but worth one last outreach. Automated analytics platforms surface these segments automatically.
Why an Analytics Layer Sits on Top of Your SMS
To be clear — your shop management system is doing its job. NAPA TRACS, Tekmetric, Mitchell 1, FreedomSoft, TireMaster, R.O. Writer, TireWorks HD, Hoops & Gears, Protractor — all strong systems for running the shop floor. The opportunity is simply that multi-location operators can layer an enterprise analytics view on top that surfaces missed revenue across their entire operation in real time, without changing anything about how the SMS works.
Finding missed revenue at scale requires an analytics layer that sits on top of your SMS, reads your data, and specifically identifies: what was due but not recommended, what was recommended but not sold, where advisor performance is uneven, which customers are slipping away. That's the complementary view SideKick360 adds alongside your existing SMS.
Frequently Asked Questions
How much revenue is the typical shop missing?
Data from SideKick360 across thousands of shops shows most operations leave 20–40% of achievable revenue on the table monthly. The biggest single bucket is overdue OEM maintenance on vehicles that were in the shop — services that were due per the manufacturer but not recommended by the advisor. For a shop doing $100K/month, that's $20K–$40K in recoverable revenue, much of it from existing customers who are already in the door.
How do I know what services should have been sold?
Compare each vehicle's mileage and service history to the manufacturer's published maintenance schedule. Any service past its interval (by mileage or time) that wasn't performed is a missed opportunity. Doing this manually is impossible at any scale — advisors handling 15 vehicles a day can't compute intervals on every car. Tools like Maintenance Hunter automate this in under 4 seconds per vehicle.
Can I find missed revenue without changing my SMS?
Yes. You don't need to migrate away from your current shop management system. SideKick360 integrates with 9 major SMS platforms (NAPA TRACS, Tekmetric, Mitchell 1, FreedomSoft, ASA TireMaster, R.O. Writer, TCS TireWorks HD, Hoops & Gears, Protractor) and adds the analytics layer on top. Your advisors keep using whatever SMS they use today.
How long before I see results?
Most shops see measurable ARO lift within 30 days of implementing proactive maintenance recommendations. Meineke Garner Group doubled revenue over 12 months. Steger Service grew GP $39K in Q1. The speed depends on how consistently advisors use the new visibility — which is why the coaching loop matters.
Ready to See What's Hiding in Your Data?
Book a free 30-minute demo and we'll pull a sample of your shop's data to show you exactly where the missed revenue is. No commitment — just a clear look at what's been walking out the door.
Related: How to Increase Average Repair Order • How to Coach Service Advisors • Multi-Unit Enterprise Analytics